
Did you know that abdominal fat increases heart disease risk by 30% even if your weight seems normal? This surprising fact highlights why understanding your composition matters more than staring at a scale. Traditional weight measurements often miss critical details about muscle mass and fat distribution—factors that directly impact your well-being.
Where your fat settles plays a significant role in health outcomes. Excess visceral fat around organs raises risks for diabetes and cardiovascular issues. At Prolific Health, we focus on precise composition analysis to help Richmond and Vancouver residents make informed decisions tailored to their unique physiology.
Tracking progress isn’t just about numbers dropping. Muscle gain can mask weight loss while improving metabolic health. Our evidence-based approach identifies these nuances, empowering you to craft strategies that align with your body’s needs through customized private training.
Key Takeaways
- Fat location impacts health risks more than total weight
- Visceral fat increases chances of diabetes and heart conditions
- Muscle development affects scale readings without reflecting true progress
- Personalized composition analysis guides effective fitness plans
- Accurate metrics help track meaningful health improvements
Introduction to Body Fat Percentage
Understanding your body’s composition unlocks insights that scales can’t measure. While weight shows one aspect, the ratio of lean tissue to fatty tissue reveals critical details about your wellness. This metric helps identify risks often hidden by “normal” numbers on traditional measurements.
What It Means for Your Health
Your system requires some fatty tissue for energy storage and organ protection. However, excess amounts—particularly around organs—can strain your heart and affect blood sugar regulation. Women naturally carry more essential fatty tissue than men due to biological needs like hormone production.
Key differences to note:
- Essential fatty tissue supports basic bodily functions
- Storage deposits influence metabolic efficiency
- Gender-specific ranges reflect hormonal requirements
How Measurements Guide Health Decisions
Accurate assessments help create targeted strategies. For example, someone with higher lean tissue might focus on cardiovascular care, while another individual could need dietary adjustments. Professionals use these insights to:
- Design nutrition plans matching your biological needs
- Adjust exercise routines for optimal results
- Monitor changes in tissue distribution over time
Local clinics in Richmond and Vancouver prioritize these metrics because they expose risks BMI calculations often miss. Regular tracking, combined with structured group strength sessions, helps you make informed choices about lifestyle changes and preventive care.
The Importance of Knowing Your Body Composition
Your scale tells part of your health story, but not the whole truth. What lies beneath the surface—the balance between lean tissue and stored energy reserves—determines your vulnerability to chronic conditions. This knowledge acts as an early warning system for risks traditional metrics overlook.
Impact on Heart Health and Overall Wellness
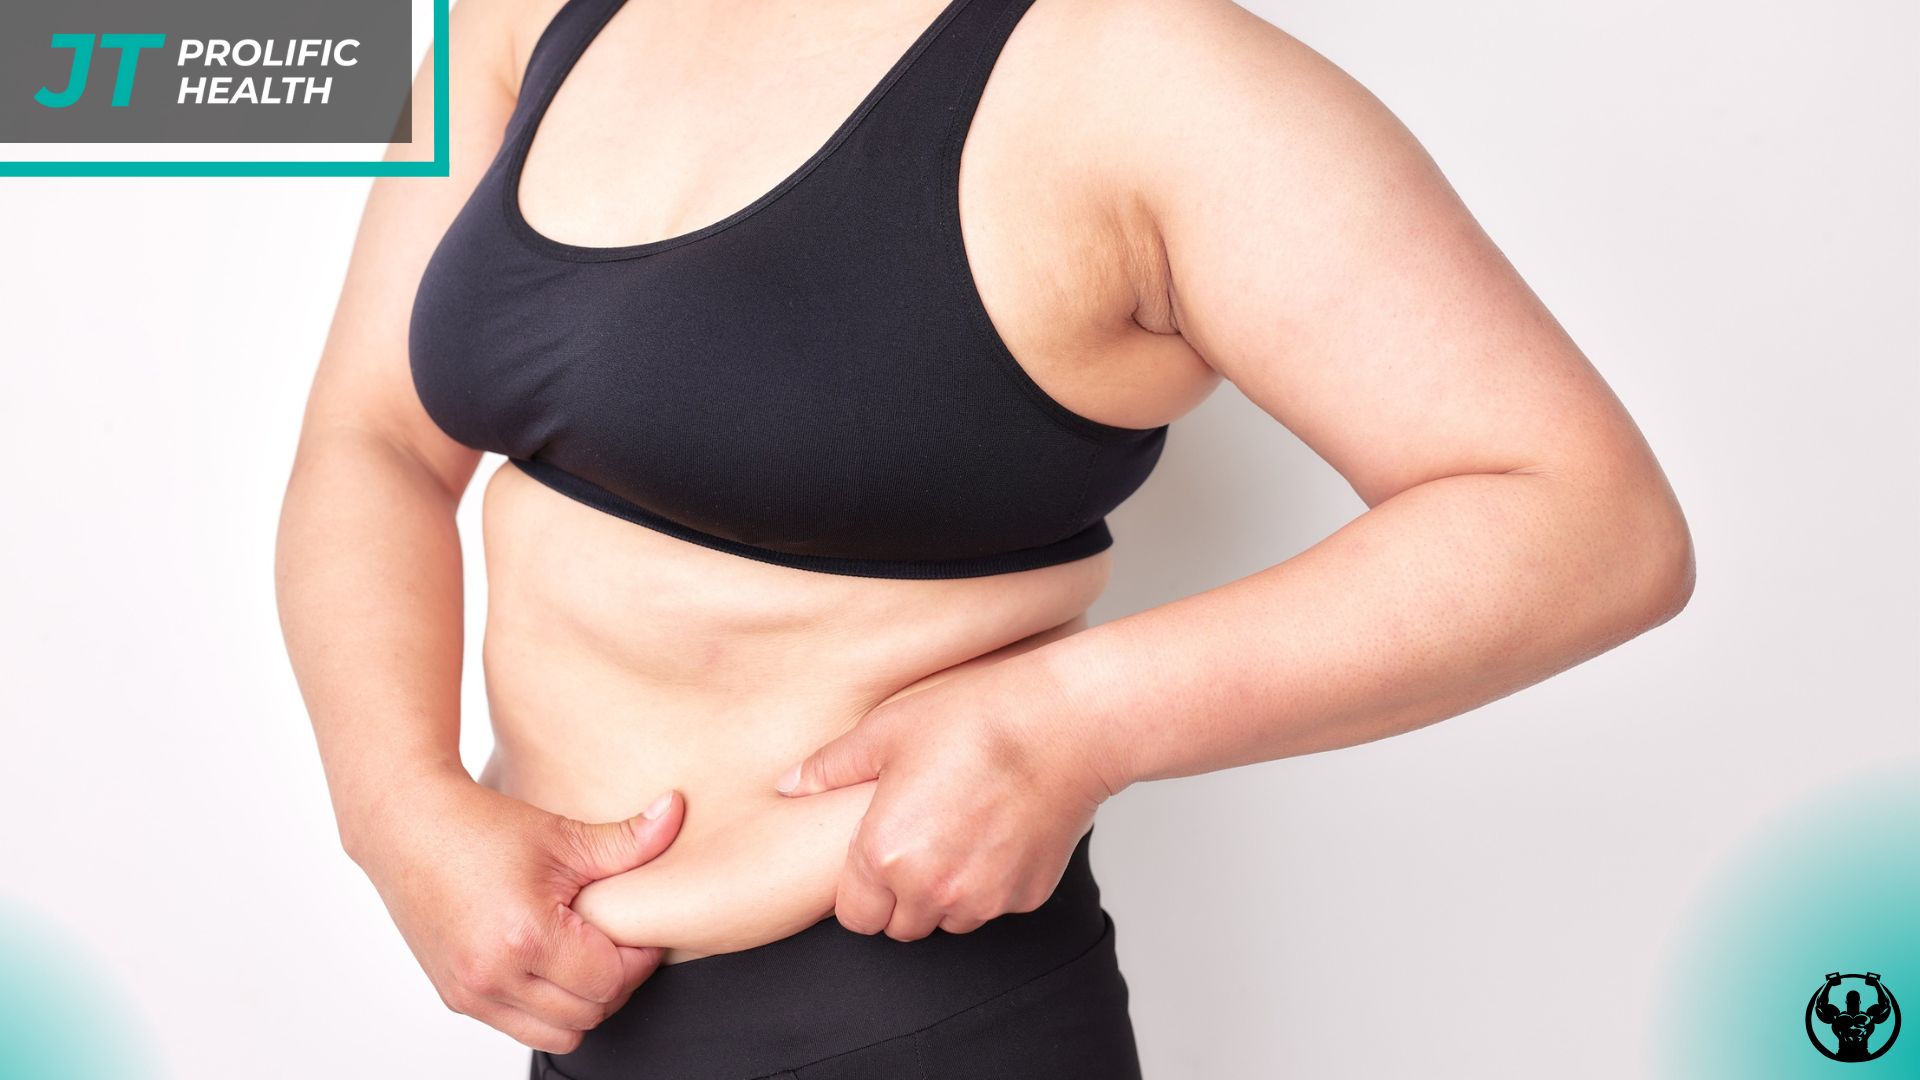
Visceral deposits around your organs release inflammatory chemicals called cytokines. These substances strain blood vessels and disrupt cholesterol balance, creating ideal conditions for arterial plaque formation. Research links this hidden fat to 40% higher diabetes risk regardless of total mass.
Muscle development plays defense against these threats. Higher lean tissue improves insulin sensitivity and helps manage blood sugar levels naturally. Consider these critical connections:
- Abdominal fat distribution predicts heart issues better than weight alone
- Optimal tissue ratios support balanced hormone production
- Improved metabolic function enhances immunity and energy
Regular composition tracking reveals patterns before symptoms appear. A stable number on the scale might hide dangerous shifts in your muscle-to-fat ratio. Advanced assessments provide clarity where BMI fails, particularly for active individuals building strength through hybrid training.
Understanding these relationships empowers smarter lifestyle choices. You’ll recognize when nutrition adjustments protect your heart or when exercise routines need modification. This proactive approach helps residents in Richmond and Vancouver address risks early, potentially avoiding serious health complications.
Methods for Estimating Your Body Fat
You might think stepping on a scale tells you everything about your health, but there’s more beneath the surface. Measuring your tissue composition requires tools ranging from basic home devices to clinical-grade systems. Each approach offers different insights into where and how your energy reserves are stored.
Simple Tools and Advanced Technologies
Home options like smart scales and waist tapes give quick estimates. These devices use electrical signals or circumference measurements to calculate approximate values. While convenient, their accuracy depends on consistent hydration levels and proper positioning.
Medical facilities in Richmond and Vancouver provide precise assessments through DEXA scans or hydrostatic tanks. These methods map tissue distribution down to the gram. They require appointments and specialized equipment but deliver lab-certified results for tracking changes over months. For those with busy schedules, online coaching offers flexibility while maintaining professional guidance.
Overview of Measurement Options
Consider these factors when choosing a method:
- Cost varies from free (waist measurements) to $150+ per scan
- Time commitments range from 2 minutes to half-day appointments
- Accuracy differences span ±1% to ±8% between techniques
Frequent check-ins with basic tools work well for weekly progress tracking. Combine them with professional assessments every 3-6 months for detailed insights. Our team helps locals navigate these options based on personal goals and accessibility.
Using Total Body Weight and BMI Effectively
Have you ever wondered why two people with the same weight can have vastly different health profiles? The answer lies in how we interpret numbers. Body Mass Index (BMI) calculates your weight relative to your height, offering a quick snapshot of potential health risks. While useful for population studies, this tool has critical blind spots you need to understand.
Understanding BMI Limitations
BMI categorizes adults into underweight, healthy, overweight, or obese ranges using simple math. However, it doesn’t distinguish between dense muscle tissue and excess fat storage. This creates misleading results for:
- Athletes with high muscle mass often labeled overweight
- Seniors experiencing natural muscle loss
- Pregnant women requiring weight adjustments
Ethnicity also influences risk levels at identical BMI scores. South Asian populations face higher diabetes risks at lower BMI ranges compared to European groups. Our team helps Vancouver and Richmond residents interpret these nuances through combined metrics.
Use BMI as a starting point, not a final verdict. Pair it with waist measurements or professional scans for accurate health assessments. This layered approach reveals what simple height-weight ratios miss, helping you make truly informed decisions about your wellness journey.
The Role of Waist Measurements in Detecting Fat Distribution
Your belt size might reveal more about your health than you realize. Where your waist sits compared to your height and hips offers critical clues about hidden risks. These measurements help identify dangerous fat patterns that scales and BMI often miss.
Waist to Height Ratio
This simple calculation involves dividing your waist circumference by your height. Values above 0.5 signal increased risks for heart issues and diabetes. For example, someone 170 cm tall should keep their waist below 85 cm. Our team teaches proper measuring techniques:
- Place the tape midway between your ribs and hip bones
- Measure after exhaling naturally
- Repeat weekly for consistent tracking
Waist to Hip Ratio Explained
This metric compares abdominal size to hip width, distinguishing apple-shaped (higher risk) from pear-shaped distributions. Men exceeding 0.90 and women over 0.85 face greater cardiovascular threats. The “string challenge” offers a quick check – if your waist is longer than half your height when folded, consult a professional.
These methods outperform BMI by revealing where fat accumulates. Visceral deposits around organs release harmful chemicals affecting blood sugar and cholesterol. Regular monitoring helps you catch risks early and adjust nutrition or exercise plans accordingly.
Skinfold Calipers and Smart Scales for Home Use
Tracking your health progress at home starts with the right tools. Affordable devices like calipers and smart scales offer practical ways to monitor changes in your tissue composition. While not as precise as clinical methods, they help spot trends when used correctly.
How Skinfold Calipers Work
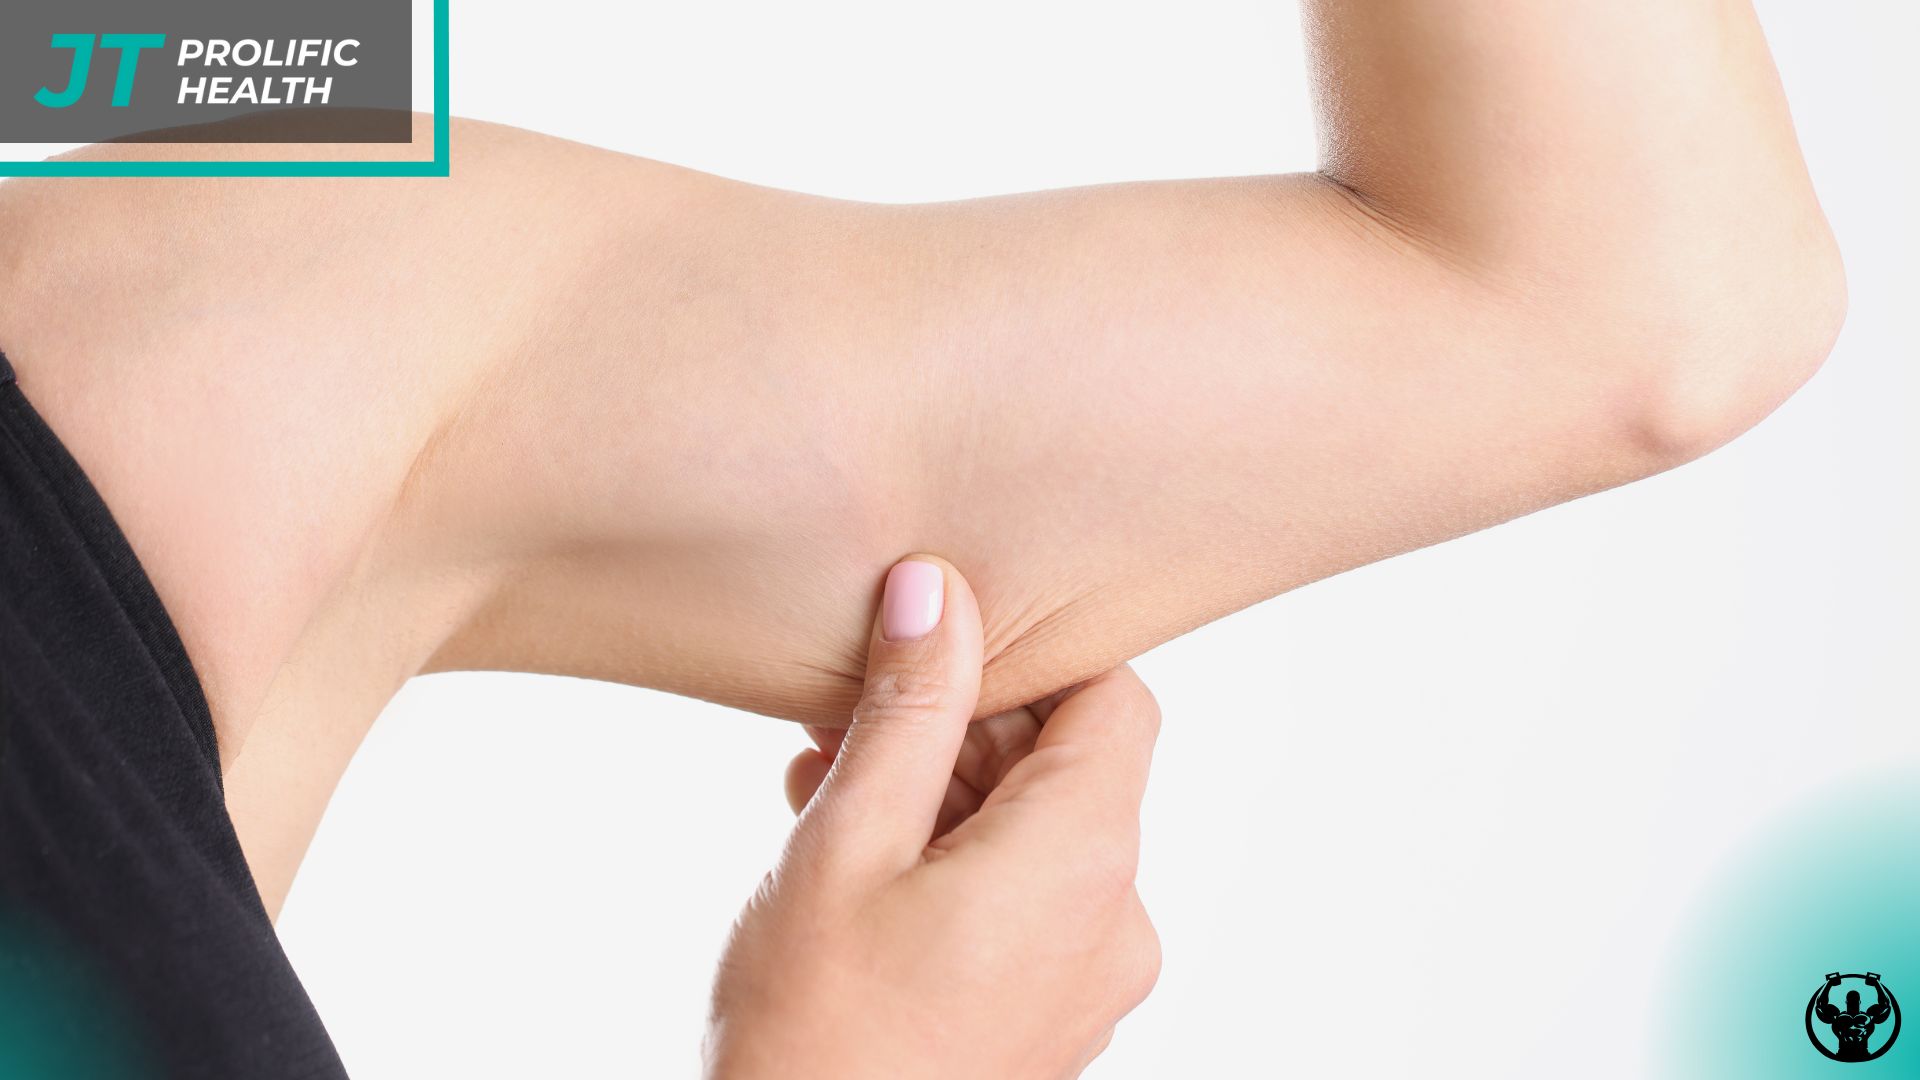
These handheld tools measure the thickness of subcutaneous tissue at specific sites like triceps or abdomen. By pinching folds of skin, they estimate total stored energy reserves. Proper technique matters:
- Take measurements at the same time daily
- Use standardized anatomical landmarks
- Record three readings per site for consistency
Smart scales use harmless electrical currents to analyze resistance through muscle and water. Hydration levels greatly affect results – drink two glasses of water 30 minutes before stepping on. Avoid using these devices if you have implanted medical electronics like pacemakers.
For reliable tracking:
- Measure first thing in the morning
- Maintain similar conditions weekly
- Combine multiple tools for cross-verification
While home methods can’t match lab precision, they reveal meaningful patterns over weeks. Richmond residents often pair monthly professional scans with weekly caliper checks to balance cost and accuracy.
Lab Testing Options for Detailed Analysis
When precision matters, advanced laboratory methods reveal what home devices can’t detect. Three clinical-grade techniques provide unmatched clarity about your tissue composition and distribution patterns. These services help Richmond and Vancouver residents make data-driven health decisions with confidence.
DEXA Scans: The Gold Standard
Dual-energy X-ray absorptiometry (DEXA) uses low-dose radiation to map bone density, muscle mass, and stored energy reserves. This 4-minute scan generates color-coded images showing exactly where tissue accumulates. Clinics often recommend it for tracking changes in abdominal distribution – a key factor in metabolic health risks.
Hydrostatic Weighing Explained
This water-based method calculates density by comparing your weight on land to underwater measurements. Since lean mass sinks more than fatty tissue, the difference reveals precise ratios. Proper technique requires full submersion and controlled breathing, making it ideal for research settings.
Air Displacement Technology
The BOD POD system offers a dry alternative to hydrostatic tanks. By measuring air pressure changes in a sealed chamber, it calculates composition with similar accuracy. Many prefer this method for its comfort and quicker setup compared to underwater testing.
Local universities and private clinics provide access to these advanced tools. While costs vary, all three methods deliver detailed regional analysis unavailable through home devices. Combine them with regular check-ups to monitor progress and adjust wellness strategies effectively.
Integrating Local Government Data and Guidelines
Regional health strategies shape personalized wellness plans more than you might expect. At Prolific Health, we combine national standards with local insights to create recommendations that reflect your community’s unique needs. If you’re ready to take action on improving your body composition and overall health, don’t hesitate to contact us.
Reference Standards in Richmond and Vancouver
Our approach aligns with Health Canada’s guidelines while addressing British Columbia’s specific priorities. Vancouver Coastal Health data shows urban residents often face different composition challenges compared to suburban areas. Walkability, access to greenspaces, and cultural food traditions all influence regional health patterns.
Richmond’s active living initiatives complement federal obesity prevention goals through community fitness programs. We help you interpret these standards within your daily life – whether adjusting nutrition for local cuisine trends or tailoring exercise to your neighborhood’s infrastructure.
Local monitoring programs emphasize early intervention through regular check-ups. By connecting provincial targets with personal metrics, you gain clearer benchmarks for sustainable progress. This fusion of macro-level data and individual analysis helps build healthier communities across Metro Vancouver.